Today I Learned
Mathematica Exclude Singularities in Plot
Mathematica Plot function brings in weird lines sometimes.
Here is an example of it. I plot
\[f(x) = \frac{1}{1-0.3 x}.\]Plot[1/(1 - 0.3 x), {x, 2, 5}, Frame -> True,
FrameLabel -> {"x", "1/(1-0.3 x)"}, ImageSize -> Large,
PlotLabel -> "Function: 1/(1-0.3 x)"]
What we get is a plot
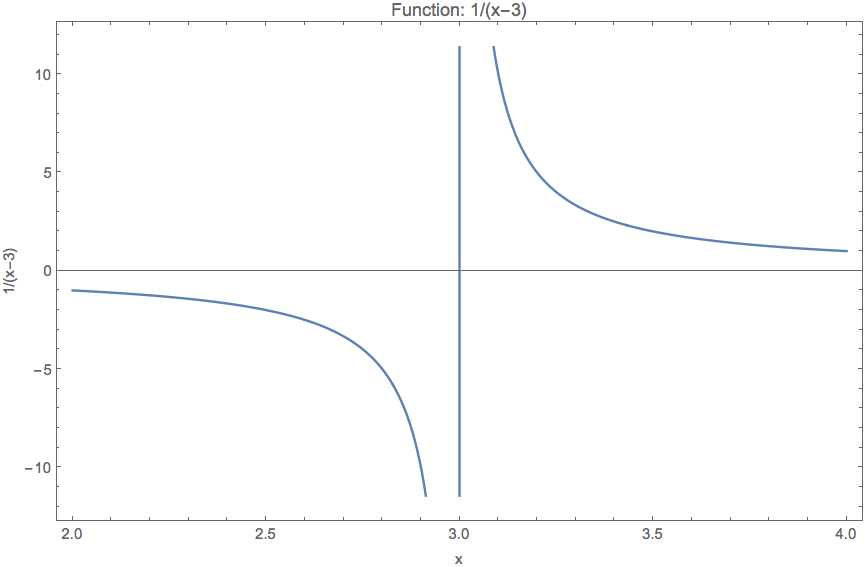
This vertical line at $x=3$ is not real. To eliminate this line, we can exclude the singularity point when plotting, using Exclusions.
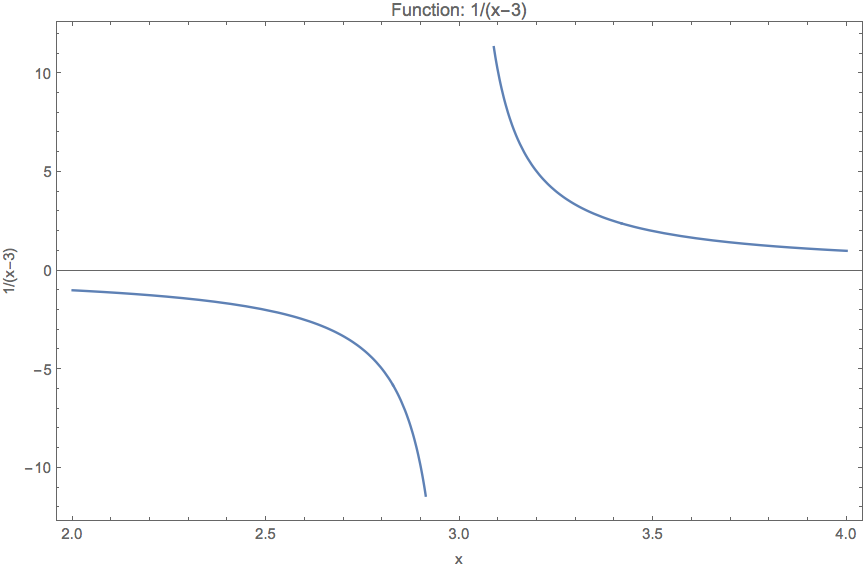
Plot[1/(x - 3), {x, 2, 4}, Frame -> True,
 FrameLabel -> {"x", "1/(x-3)"}, ImageSize -> Large,
 PlotLabel -> "Function: 1/(x-3)", Exclusions -> {3}]
The plot we get now is much better.